Want to Trade RED High-Impact Economic Data points?
New Economic Calendar Package Gives Away 3 Institutional Secrets to Trade Risk Events
This will leave ForexFactory Users at a Huge Disadvantage
I’d Like to give you this for FREE
but we pay thousands of dollars each month for developer costs and real time data feeds, so I’m asking for $19 per month to help offset some of our costs.
The 3 Money Making “Secrets” That Professional Traders Use Every Day To Trade Risk Events

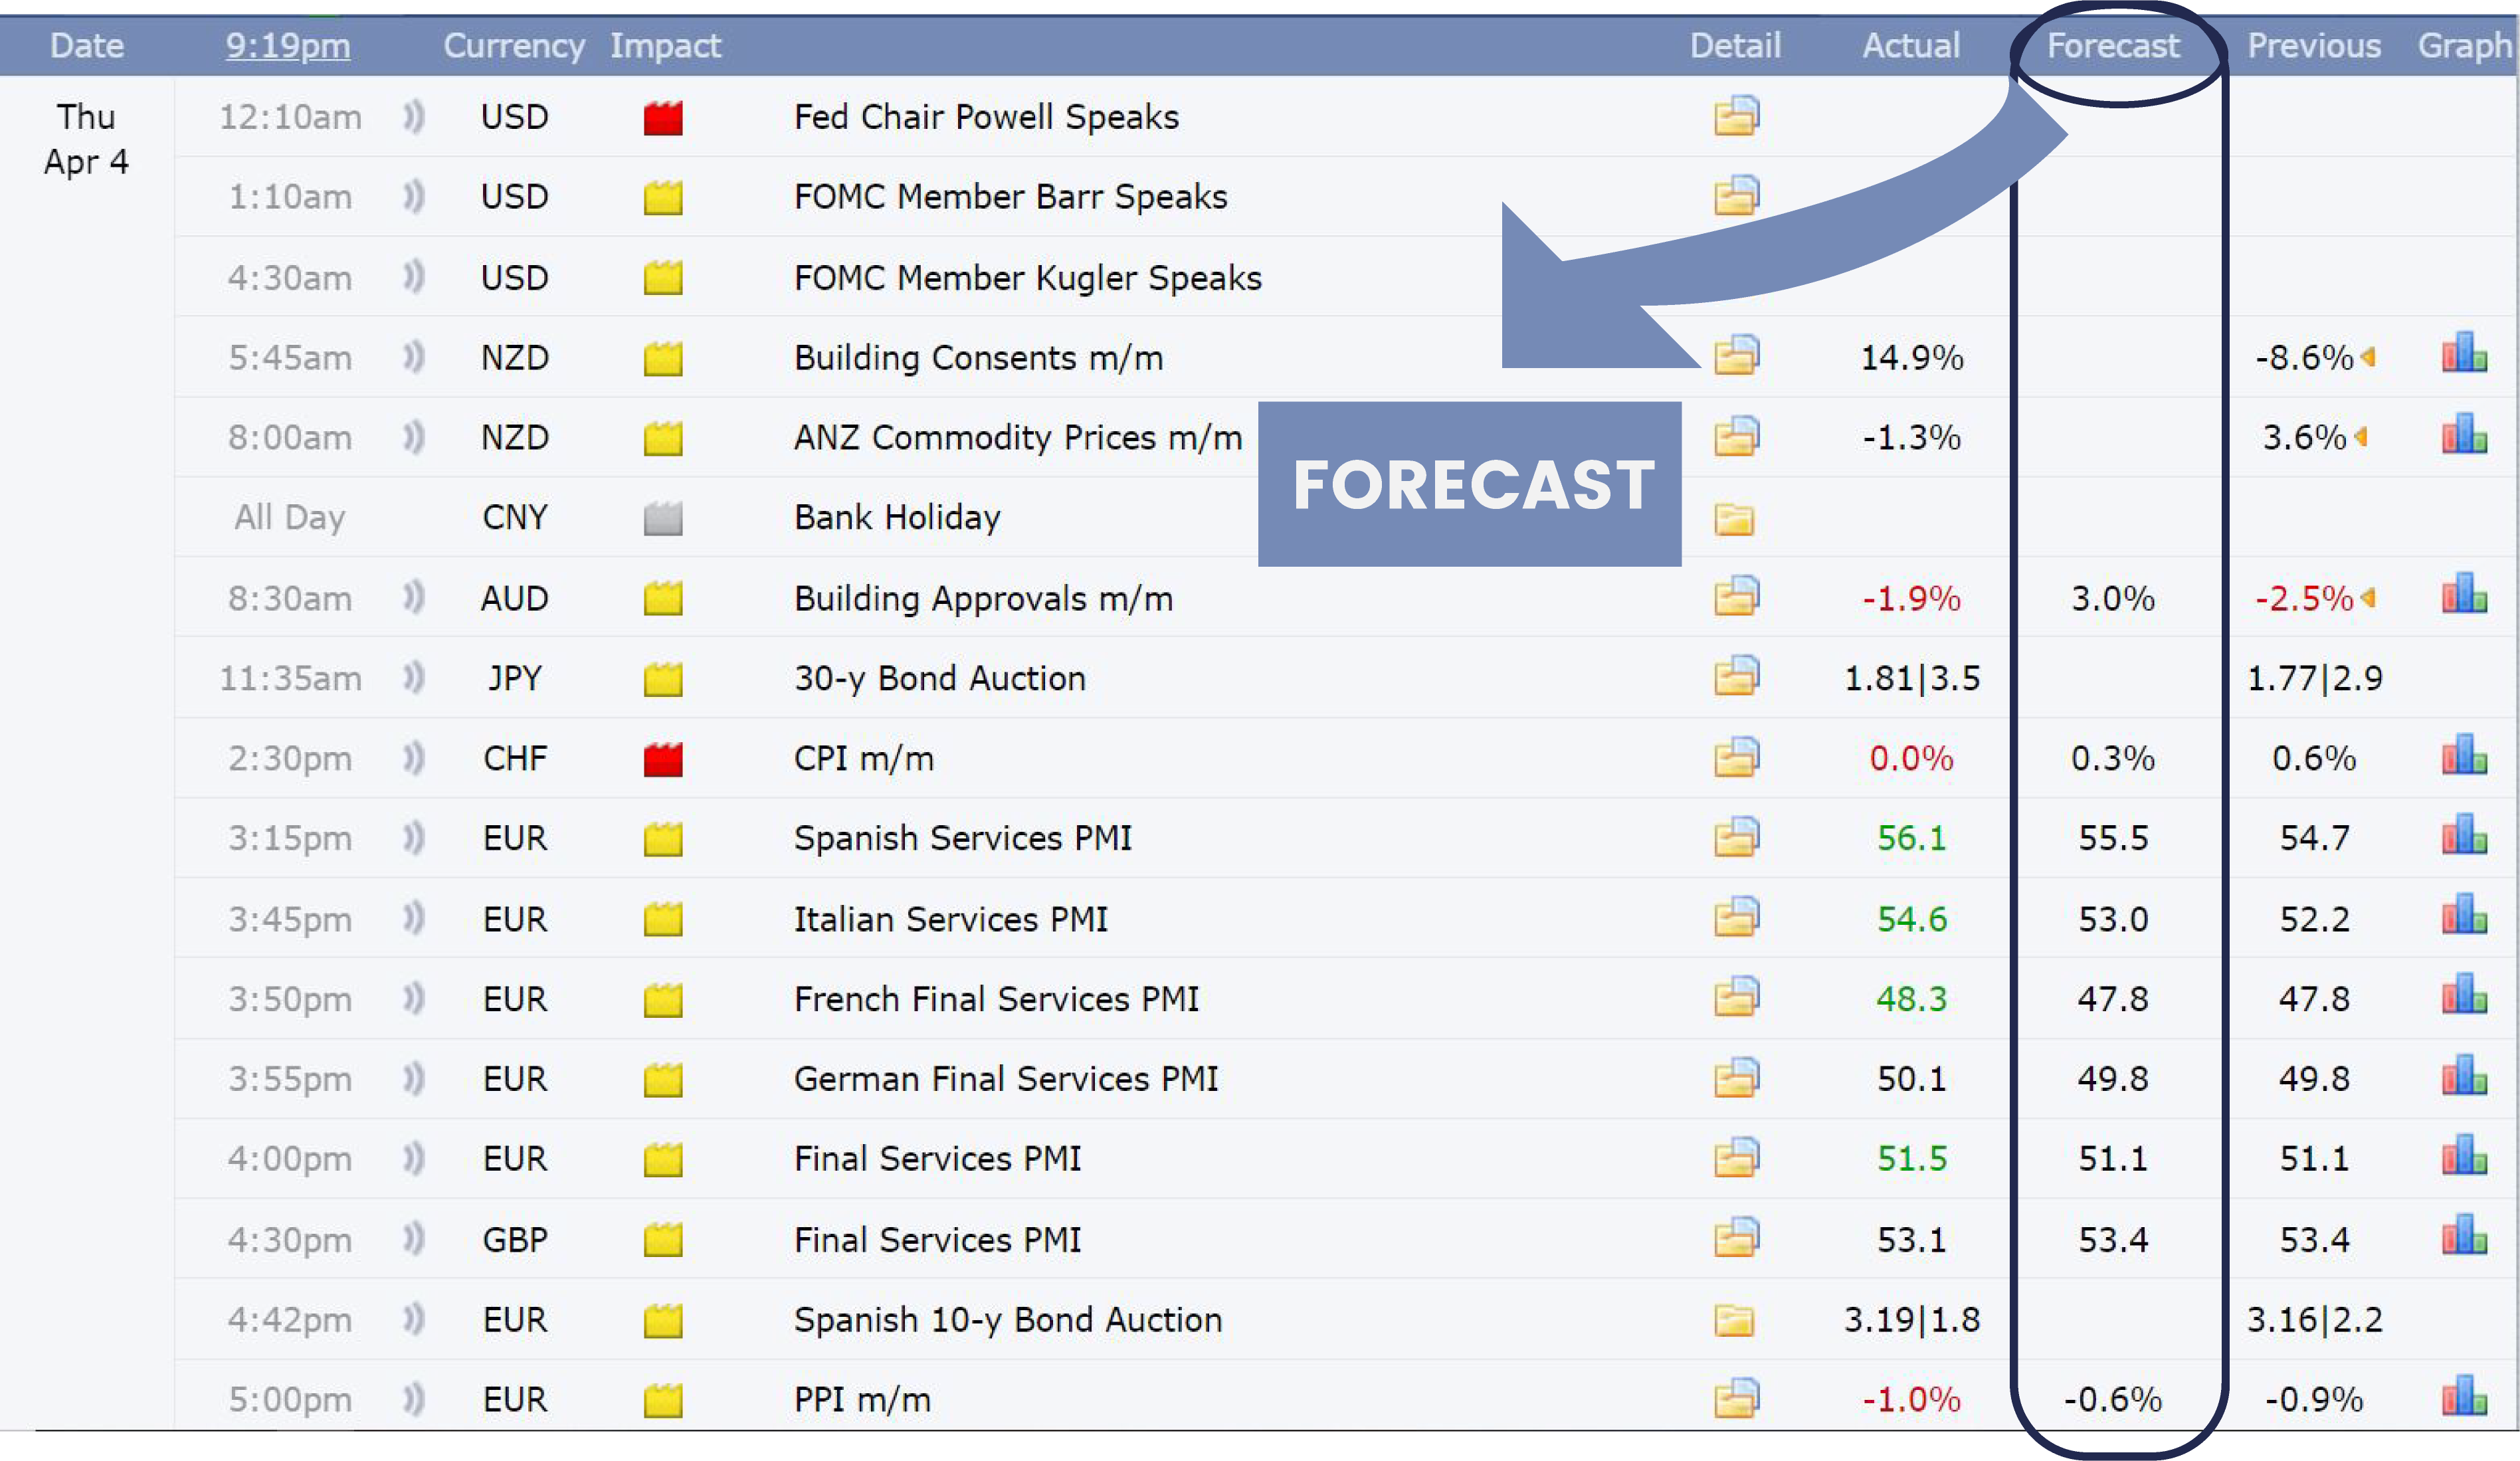
This shows us what the analysts are expecting at the lowest end of their projections and it also shows us what they are expecting at the highest end of their projections.
The great risk events trades that really move the market are ones that shock all of the analyst expectations by being higher than their high projections or lower than their low projections.
This is why the “median forecast” on retail calendars isn’t helpful. You aren’t able to tell how dramatic an economic deviation is. But if the number comes out above the “high estimate” or below the “low estimate” you know it is truly a surprise to the market.
Professional Economic Calendars also include the “High Estimate” and the “Low Estimate”
This shows us what the analysts are expecting at the lowest end of their projections and it also shows us what they are expecting at the highest end of their projections.
The great risk events trades that really move the market are ones that shock all of the analyst expectations by being higher than their high projections or lower than their low projections.
This is why the “median forecast” on retail calendars isn’t helpful. You aren’t able to tell how dramatic an economic deviation is. But if the number comes out above the “high estimate” or below the “low estimate” you know it is truly a surprise to the market.
The other advantage professional traders have is the “lightning bolt feature.”
This lightning bolt pops up immediately if there is a deviation above the high forecast or below the low forecast.
This gives them a huge timing advantage as they don’t even need to think about the numbers but can get straight away into a trade.


Remember if the lighting bolt appears it signals a “shock” deviation. No analysts surveyed expected this number. That is why these deviations move the market.
But the next question is – WHAT events should I trade? What events should I stay away from? Which events would be a waste of time?
Secret #2: Institutional Traders know WHAT economic data points are worth their time and which ones will be a snooze fest
Over the last months there are hundreds of data points to focus on, but which ones will really move the market?
Institutional traders understand that the market is focused on the economic events that the respective Central Bank is focusing on that week.
Most times this is a select number of “red” market moving events such as employment and inflation. But if the “baseline” of the central bank is truly “data dependent” from their last meeting, even lower tier “red” economic events or even orange events can significantly move the market.
The market will also move more dramatically on economic events that contradict the central bank’s baseline stance. EG – A central bank stance is that “inflation is moving in the right direction.” Then a CPI print shows inflation going in the wrong direction and you have a great trade on your hands.
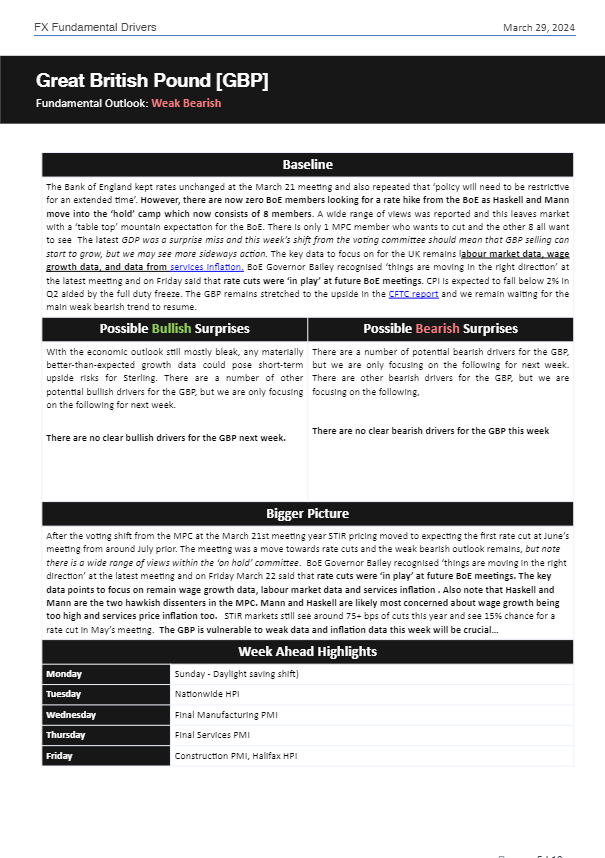
We’ve prepared a fundamental report which highlights a limited number of events each week to show up and trade, including the baseline expectations, possible bullish surprises and possible bearish surprises.
You don’t have to guess which events will be worth your time!
Institutional Traders also know WHICH central bank meetings will be worth their time
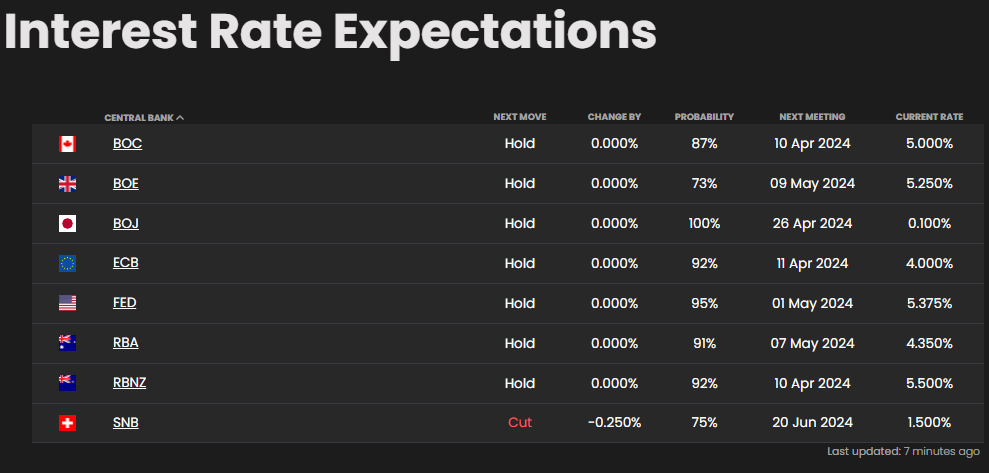
Retail calendars will show a central bank meeting in a very basic way. Are they expected to be on hold or are they expected to cut or hike?
Professional Traders know the exact probability of a hike, hold or cut because they use an interest rate tracker like ours pictured above.
So they know at the next Bank of England Meeting or the next Swiss National Bank meeting there is a high probability of a good move.
Because in the Bank of England’s case there is only a 75% chance of a hold. If they cut rates at their next meeting…retail traders would say it’s a “surprise.”
But institutional traders knew the real odds and showed up to trade the event.
Secret #3: Institutional traders know which Forex Pairs will move the most on data releases because they have access to professional reports.
If you’ve been caught out trading the wrong pair…you’ll know what I mean. You prepare for the event, sit down at your computer and have your charts open.
A major economic data deviation is released and you jump into your favourite currency pair. But nothing happens…the pair moves about 10 pips and then just stalls and you feel trapped thinking “should I stay in or cut the trade for a small profit or loss?”
There are a few institutional reports that professional traders use to get the upper hand and know exactly which currency pair will give them the most movement.
First is the City Economic Surprise Index report
This is a study which shows you the impact of economic data points that surprise to the upside or the downside and how that relates to the currency pair. So every week this report identifies the specific currency pair that is the most sensitive to data deviations and when a pair is becoming increasingly sensitive or desensitised data releases.
Second is called the Risk-Reversal report
This shows you the positioning of options traders in the market showing you a buildup of call options or put options on a certain pair expressing a buy or sell bias. Let’s say you have massive call options building on the USD/JPY. Then a major economic release weakens the dollars and strengthens the JPY. Now those call options were hoping that the USD/JPY appreciates…instead are vulnerable to getting liquidated, causing the USD/JPY to have an outsized move downward compared to other Forex pairs.
Third is called the CFTC report
This report shows us the positioning of hedge funds and big players in the space and it shows you whether they are building long or short positions in an easy to understand format.
Now the magic is in using all of these reports together to choose the correct pair to give you the most movement.
If you are approaching a major CPI release – an institutional trader will check the City Economic Surprise Index to find which pair is the most sensitive to data releases.
They will then check to see if there are stretched positions in the options market and the CFTC report.
Let’s say the City Economic Surprise Index told the institutional trader that the USD/JPY was the most sensitive right now for economic data release.
He then checked the Risk-reversal report and noticed a bunch of call options building…giving a bullish bias to the pair.
He then checks the CFTC report and noticed that major players were building long positions into the USD.
Now what happens if the CPI release comes out bad for the dollar?
All those options traders who wanted the USD/JPY to appreciate start getting squeezed and all the major players like hedge funds and banks going long the USD/JPY will need to liquidate some of their positions.
In this hypothetical scenario…this results in an outsized move down on the USD/JPY.
Ready to put the odds in your favour?
Get Everything in our Professional Economic Calendar Package
- Real time Economic Calendar
- High-low readings
- Lightning-bolt Feature
- Fundamental drivers report so you know WHAT to trade
- Interest Rate Probability Tracker so you know WHICH central bank events to trade
- City Economic Surprise Index report, Risk-Reverals Report and CFTC Report so you know which pairs will move the most.
We pay thousands of dollars each month for developer costs and real time data feeds. We just ask for $19 per month to help offset our data costs!